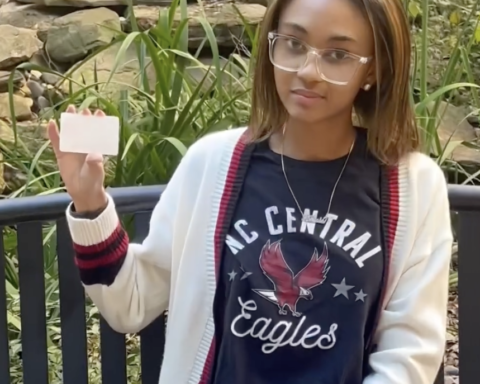
N.C. Central University welcomed 1,572 new Eagles to the verdant green, 22 more students than last year. Of these, 1,134 are incoming freshmen joining the class of 2020, and 438 are transfers from other colleges and community colleges.
Also topping last year’s record is the number of applicants. Last year, there were 13,646 applicants, and this year, that number grew to more than 17,100, a whopping increase of 3,454.
The growing discrepancy between the number of male and female students admitted to NCCU has continued unabated.
Last year, 742 female students made up 66% of the class, and male students, at 383, made up 34%. This year, the gap increased by 2%, with 752 women and 357 men in the class of 2020.
In other words, 68% of the incoming students are women. This gender gap is common with non-HBCU African American college students.
“Black women outnumber black men 60% to 40% on college campuses around the country,” according to TheProfessionalCounsler.com.
While not as dramatic, this trend, often referred to as the “feminization” of higher education, extends to white students in predominantly white universities, as well.
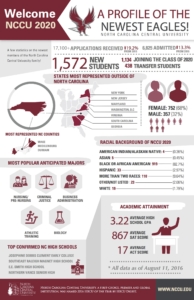
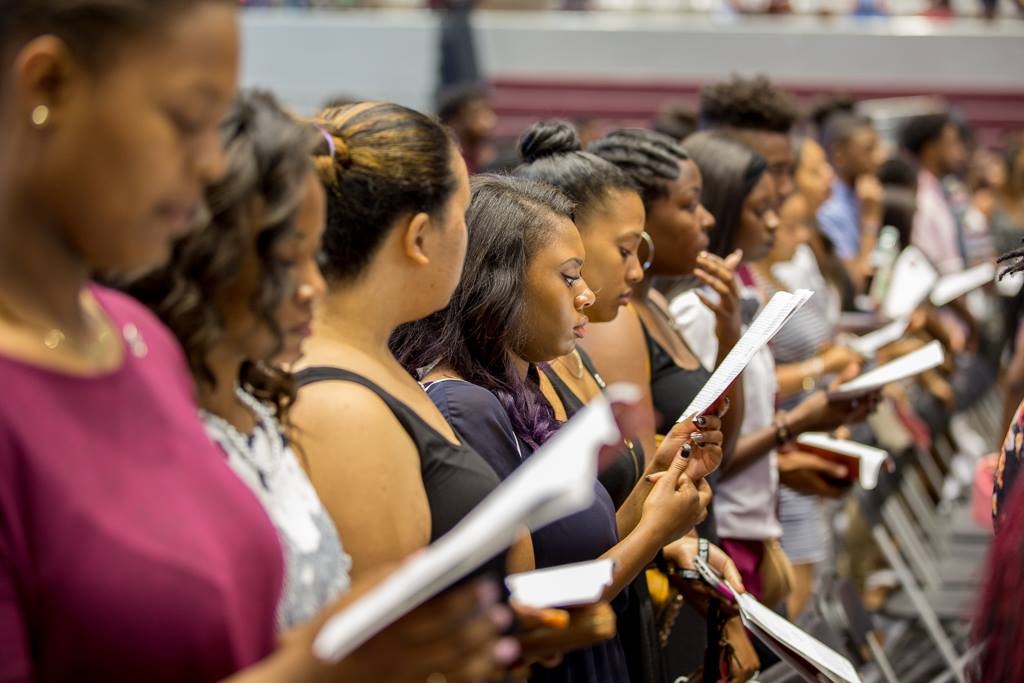
Photo Courtesy of NCCU
“This phenomenon is present among all major races and ethnic groups,” writes Kelvin Pollard in a report for the Population Reference Bureau on the gender gap in college enrollment and graduation.
The overall trend of women earning more bachelor’s degrees than men started around 1991.
The GPA of incoming students held steady from last year. Student GPAs averaged out to around 3.2.
College admission test scores didn’t fluctuate much, either.
The average SAT score was slightly lower. Last year’s incoming Eagles had 878 as their average while this year’s average SAT score was 867.
Last year’s ACT average score was 18, beating out this year’s by one point.
Although these two classes have a lot of differences, a few things haven’t changed. Nursing, criminal justice, and biology, remain popular majors.
Out-of-state students are still coming predominantly from Washington, D.C., Virginia, South Carolina, and Georgia.
Just under 83%, or 919, of incoming students are black or African American.
The second largest racial group defines itself as “more than two races,” a group that is composed of just under 10%, or 110, of the incoming students.
Hispanics make up just under 3%, or 33, of the incoming students, and whites make up just short of 2%, or 19, of incoming students.
The remaining 32 students are either Asian, American Indian, or “other.”

